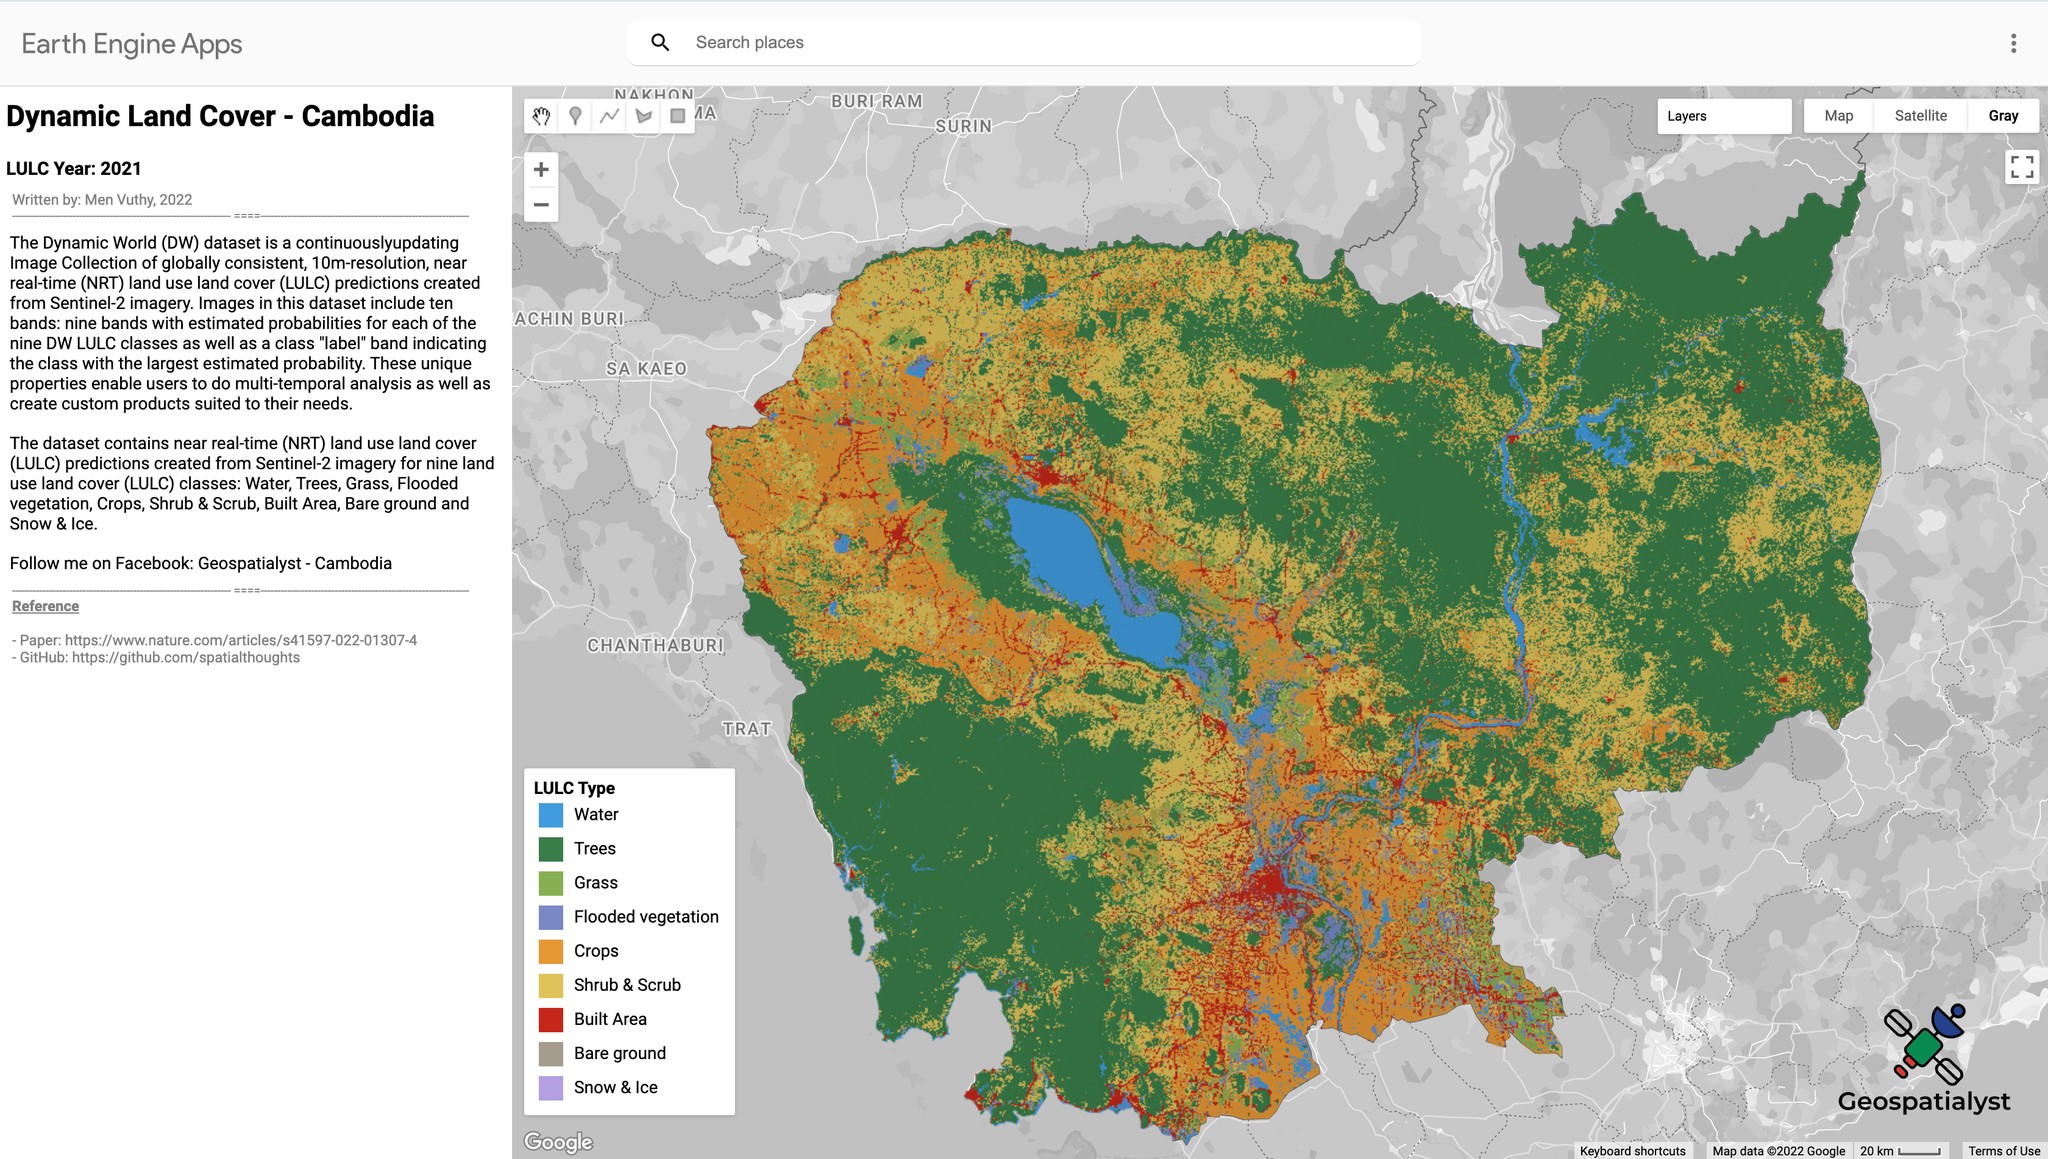
𝗗𝘆𝗻𝗮𝗺𝗶𝗰 & 𝗡𝗲𝗮𝗿 𝗿𝗲𝗮𝗹-𝘁𝗶𝗺𝗲 𝗟𝗮𝗻𝗱 𝗨𝘀𝗲 𝗟𝗮𝗻𝗱 𝗖𝗼𝘃𝗲𝗿 𝗠𝗮𝗽𝗽𝗶𝗻𝗴 - 𝗖𝗮𝗺𝗯𝗼𝗱𝗶𝗮
Written by Men Vuthy, 2022
Overview
The Dynamic World (DW) dataset is a continuously updating Image Collection of globally consistent, 10m-resolution, near real-time (NRT) land use land cover (LULC) predictions created from Sentinel-2 imagery.
The dataset contains near real-time (NRT) land use land cover (LULC) predictions created from Sentinel-2 imagery for nine land use land cover (LULC) classes: Water, Trees, Grass, Flooded vegetation, Crops, Shrub & Scrub, Built Area, Bare ground and Snow & Ice.
Read more at:
Objective
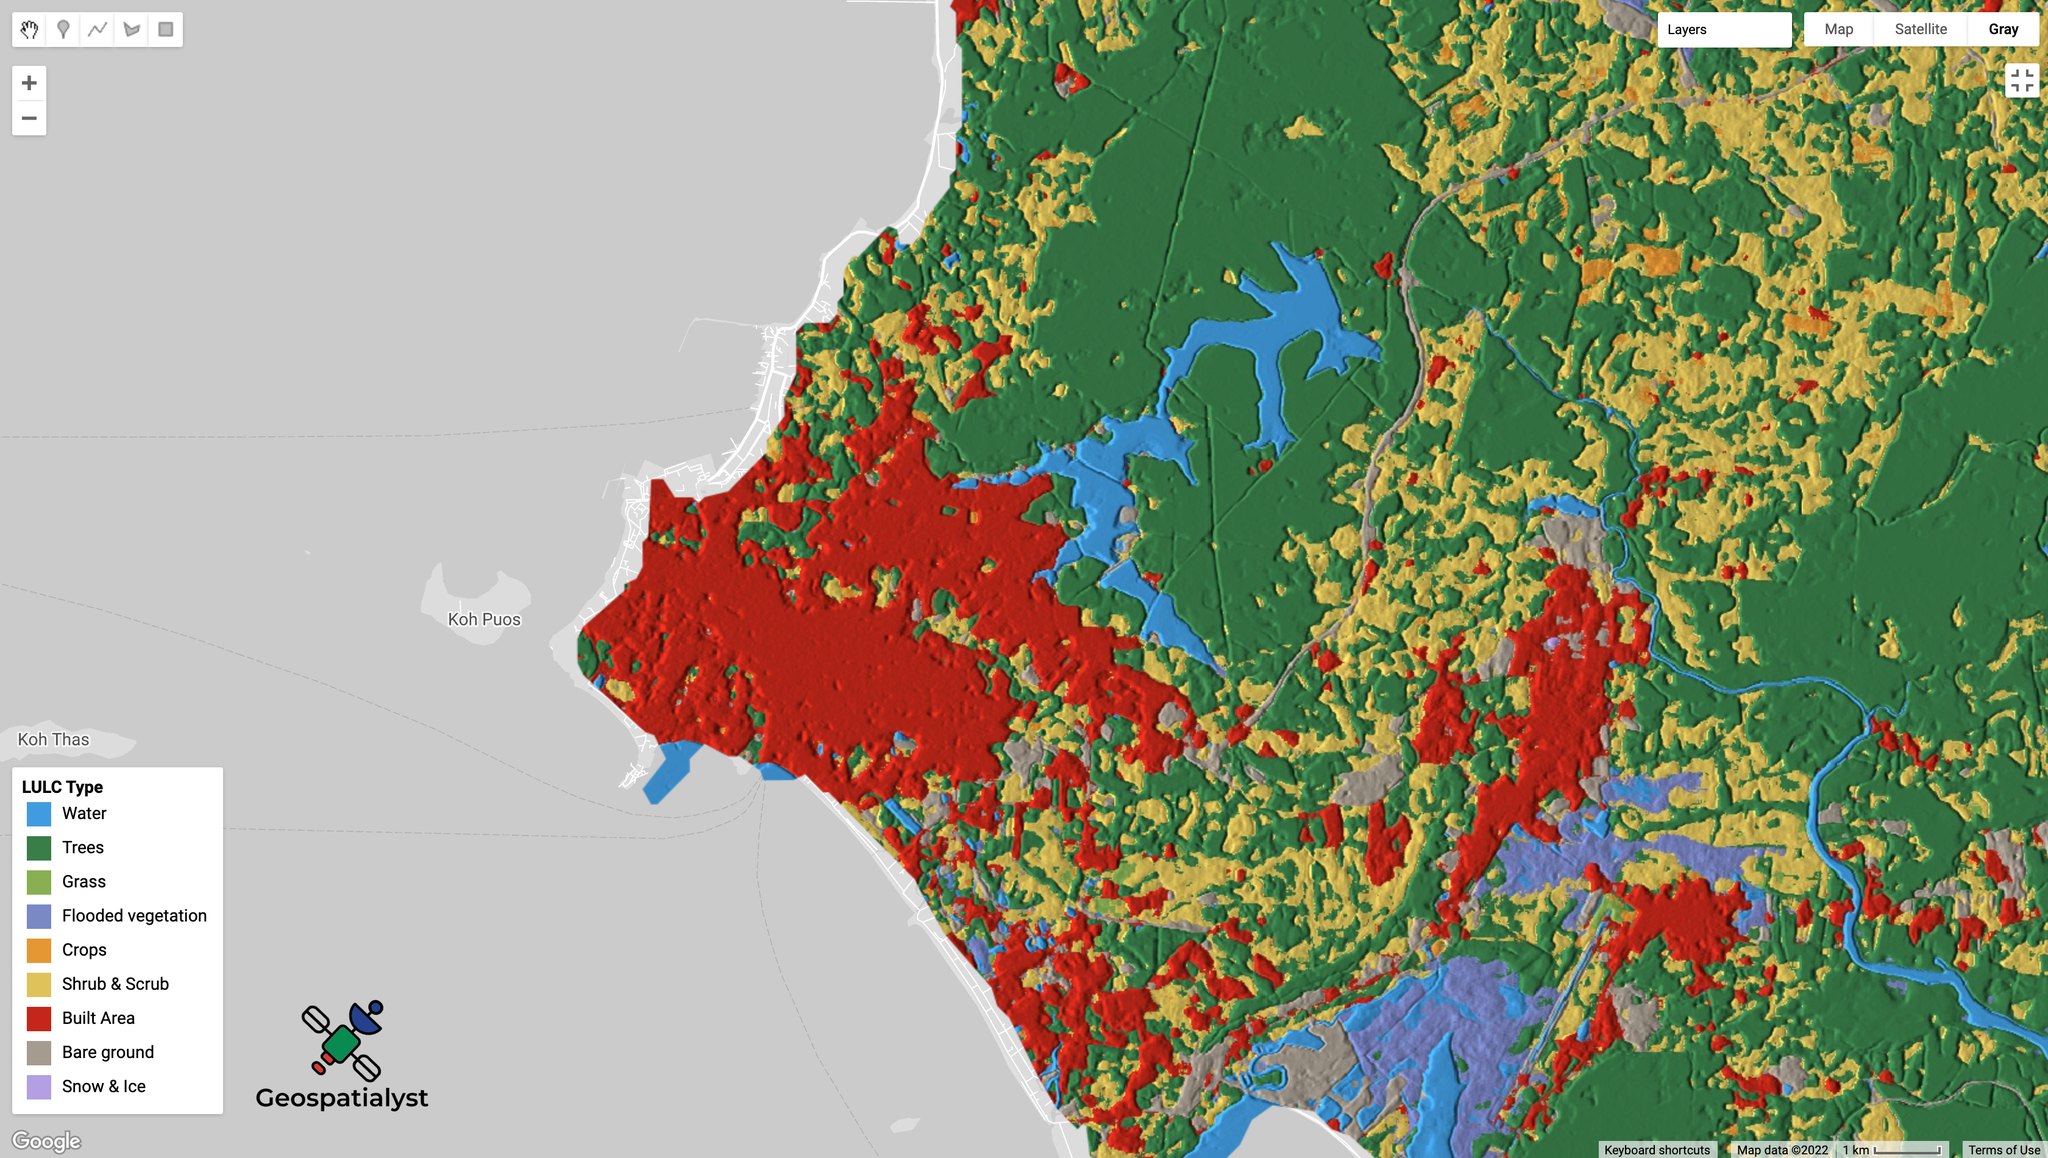
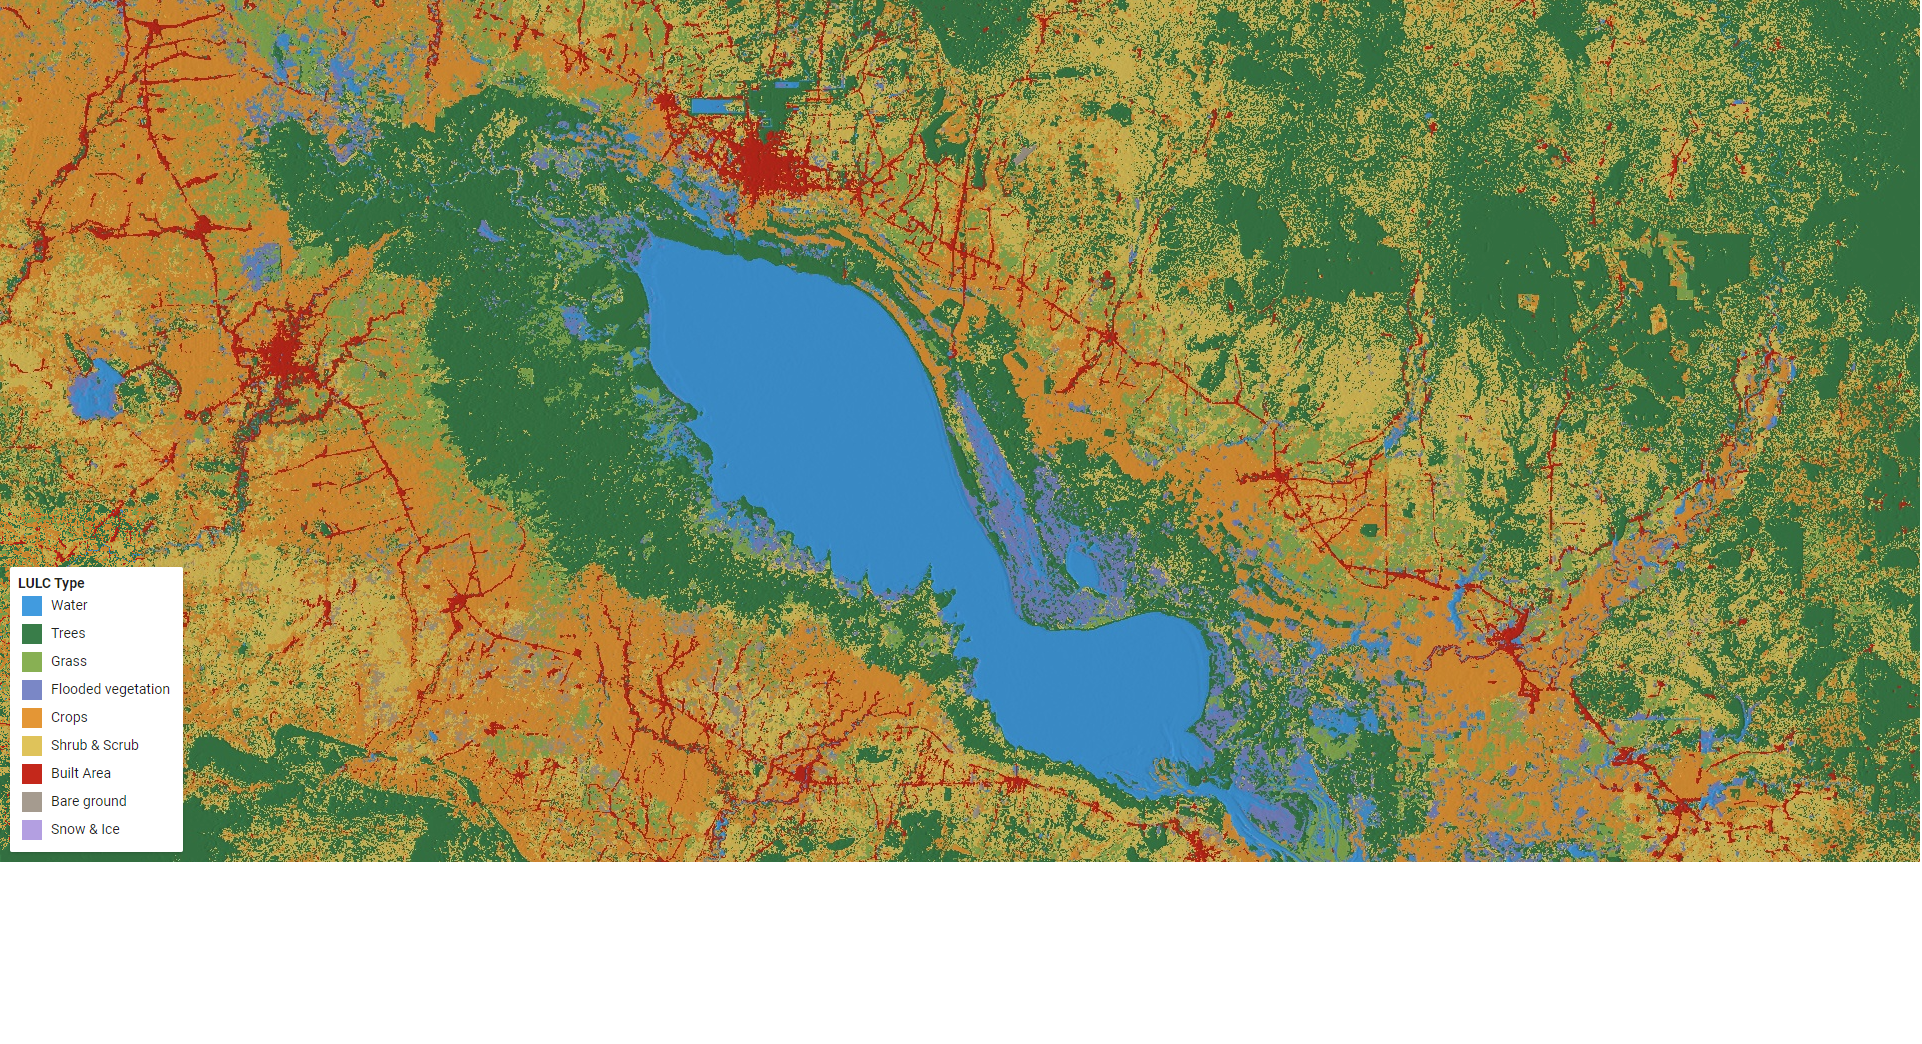
Create an GEE App to visualize dynamic and near real-time land use and land cover in Cambodia.
Code
// Generate main panel and add it to the map.
var panel = ui.Panel({style: {width:'25%'}});
ui.root.insert(0,panel);

// Define title and description.
var intro = ui.Label('Dynamic Land Cover - Cambodia',
{fontWeight: 'bold', fontSize: '24px', margin: '10px 5px'}
);
var year = ui.Label('LULC Year: 2021',
{fontWeight: 'bold', fontSize: '15px', margin: '10px 5px'}
);

var subtitle = ui.Label('The Dynamic World (DW) dataset is a continuously\
updating Image Collection of globally consistent, 10m-resolution, \
near real-time (NRT) land use land cover (LULC) predictions created \
from Sentinel-2 imagery. Images in this dataset include ten bands: \
nine bands with estimated probabilities for each of the nine DW LULC \
classes as well as a class "label" band indicating the class with the \
largest estimated probability. These unique properties enable users to \
do multi-temporal analysis as well as create custom products suited to \
their needs.', {});

var subtitle1 = ui.Label('The dataset contains near real-time (NRT) \
land use land cover (LULC) predictions created from Sentinel-2 imagery \
for nine land use land cover (LULC) classes: Water, Trees, Grass, Flooded \
vegetation, Crops, Shrub & Scrub, Built Area, Bare ground and Snow & Ice.', {});

var subtitle2 = ui.Label('Follow me on Facebook: Geospatialyst - Cambodia');

var reference = ui.Label('Reference', {margin: '0 0 0 10px',fontSize: '12px',fontWeight:'bold',color: 'grey',textDecoration: 'underline' });
var paper = ui.Label('- Paper: https://www.nature.com/articles/s41597-022-01307-4',
{margin: '0 0 0 10px',fontSize: '12px',color: 'gray'});
var github = ui.Label('- GitHub: https://github.com/spatialthoughts',
{margin: '0 0 0 10px',fontSize: '12px',color: 'gray'});

var space2 = ui.Label('-', {margin: '0 0 0 10px',fontSize: '12px',color: 'white'});


var description3 = ui.Label('Written by: Men Vuthy, 2022',
{margin: '0 0 0 10px',fontSize: '12px',color: 'gray'});

var line1 = ui.Label('-----------------------------------------------------------------\
                ====--------------------------------------------------------------',
{margin: '0 0 0 10px',fontSize: '10px',color: 'gray'});

var line2 = ui.Label('-----------------------------------------------------------------\
                ====--------------------------------------------------------------',
{margin: '0 0 0 10px',fontSize: '10px',color: 'gray'});

// Add title and description to the panel.
panel.add(intro).add(year).add(description3).add(line1).add(subtitle).add(subtitle1).add(subtitle2).add(line2)
.add(reference).add(space2).add(paper).add(github);

var GRAYMAP = [
{   // Dial down the map saturation.
stylers: [ { saturation: -100 } ]
},{ // Dial down the label darkness.
elementType: 'labels',
stylers: [ { lightness: 20 } ]
},{ // Simplify the road geometries.
featureType: 'road',
elementType: 'geometry',
stylers: [ { visibility: 'simplified' } ]
},{ // Turn off road labels.
featureType: 'road',
elementType: 'labels',
stylers: [ { visibility: 'off' } ]
},{ // Turn off all icons.
elementType: 'labels.icon',
stylers: [ { visibility: 'off' } ]
},{ // Turn off all POIs.
featureType: 'poi',
elementType: 'all',
stylers: [ { visibility: 'off' }]
}
];

Map.setOptions('Gray', {'Gray': GRAYMAP});


// Define map center (In this case in Cambodia)
// Load country features from Large Scale International Boundary (LSIB) dataset.
var countries = ee.FeatureCollection('USDOS/LSIB_SIMPLE/2017');
var geometry = countries.filter(ee.Filter.eq('country_co', 'CB'));
Map.centerObject(geometry, 8)


// Filter the Dynamic World NRT collection
// for the year 2021 over the selected region.
var startDate = '2021-01-01';
var endDate = '2022-01-01';

var dw = ee.ImageCollection('GOOGLE/DYNAMICWORLD/V1')
.filter(ee.Filter.date(startDate, endDate))
.filter(ee.Filter.bounds(geometry))

// Create a Mode Composite
var classification = dw.select('label')
var dwComposite = classification.reduce(ee.Reducer.mode());

var dwVisParams = {
min: 0,
max: 8,
palette: ['#419BDF', '#397D49', '#88B053', '#7A87C6',
    '#E49635', '#DFC35A', '#C4281B', '#A59B8F', '#B39FE1']
};

// Clip the composite and add it to the Map
// Map.addLayer(dwComposite.clip(geometry), dwVisParams, 'Classified Composite')

// Create a Top-1 Probability Hillshade Visualization
var probabilityBands = [
    'water', 'trees', 'grass', 'flooded_vegetation', 'crops',
    'shrub_and_scrub', 'built', 'bare', 'snow_and_ice'
    ];

// Select probability bands
var probabilityCol = dw.select(probabilityBands)

// Create a multi-band image with the average pixel-wise probability
// for each band across the time-period
var meanProbability = probabilityCol.reduce(ee.Reducer.mean())

// Composites have a default projection that is not suitable
// for hillshade computation.
// Set a EPSG:3857 projection with 10m scale
var projection = ee.Projection('EPSG:3857').atScale(10)
var meanProbability = meanProbability.setDefaultProjection(projection)

// Create the Top1 Probability Hillshade
var top1Probability = meanProbability.reduce(ee.Reducer.max())
var top1Confidence = top1Probability.multiply(100).int()
var hillshade = ee.Terrain.hillshade(top1Confidence).divide(255)
var rgbImage = dwComposite.visualize(dwVisParams).divide(255);
var probabilityHillshade = rgbImage.multiply(hillshade)

var hillshadeVisParams = {min:0, max:0.8}
Map.addLayer(probabilityHillshade.clip(geometry),
hillshadeVisParams, 'Probability Hillshade')

//----------------------------- Display legend on the map --------------------------//
var panel = ui.Panel({
style: {
    position: 'bottom-left',
    padding: '5px;'
}
})

var title = ui.Label({
value: 'LULC Type',
style: {
    fontSize: '14px',
    fontWeight: 'bold',
    margin: '0px;'
}
})

panel.add(title)

var color = ['#419BDF', '#397D49', '#88B053', '#7A87C6',
    '#E49635', '#DFC35A', '#C4281B', '#A59B8F', '#B39FE1']
var lc_class = ['Water', 'Trees', 'Grass', 'Flooded vegetation', 'Crops',
    'Shrub & Scrub', 'Built Area', 'Bare ground', 'Snow & Ice'
    ]

var list_legend = function(color, description) {

var c = ui.Label({
    style: {
    backgroundColor: color,
    padding: '10px',
    margin: '4px'
    }
})

var ds = ui.Label({
    value: description,
    style: {
    margin: '5px'
    }
})

return ui.Panel({
    widgets: [c, ds],
    layout: ui.Panel.Layout.Flow('horizontal')
})
}

for(var a = 0; a < 9; a++){
panel.add(list_legend(color[a], lc_class[a]))
}

Map.add(panel)
Result