
Convert from Vector to Raster
Written by Men Vuthy, 2022


Import necessary modules
[ ]:
!pip install rasterio
!pip install geopandas
[2]:
import os
import numpy as np
import rasterio
from rasterio.features import rasterize
from rasterio.transform import from_bounds
import geopandas as gpd
import matplotlib.pyplot as plt
Mount drive
[3]:
from google.colab import drive
drive.mount('/content/drive')
Drive already mounted at /content/drive; to attempt to forcibly remount, call drive.mount("/content/drive", force_remount=True).
[4]:
cd /content/drive/MyDrive/Colab Notebooks/Z. Other topics/Convert shapefile to raster
/content/drive/MyDrive/Colab Notebooks/Z. Other topics/Convert shapefile to raster
Load dataset
[5]:
# Load raster image for reference
image_ref = rasterio.open('data/kano_20180429_wgs84.tiff')

# Load survey data shapefile or json file
geo_survey = gpd.read_file('data/水国/H30植物群落.shp').to_crs(image_ref.crs)
[6]:
geo_survey
[6]:
| Id | code | area_ha | 基本分類 | 基本分類No | 群落コード | 群落表示コ | 群落名 | lyr_code | 調査管理番 | 河川コード | 調査年度 | 調査回 | 調査年月日 | 表示用 | geometry | |
|---|---|---|---|---|---|---|---|---|---|---|---|---|---|---|---|---|
| 0 | 0 | 02 | 0.042844 | 沈水植物群落 | 1 | 1003 | 013 | ホザキノフサモ群落 | WA8312 | R2018_85_11350_3_U29358 | 9-85-501-001-000-2 | 2018 | 1 | 20181105 | None | POLYGON ((138.93902 35.05341, 138.93902 35.053... |
| 1 | 0 | 02 | 0.015477 | 沈水植物群落 | 1 | 1003 | 013 | ホザキノフサモ群落 | WA8312 | R2018_85_11350_3_U29358 | 9-85-501-001-000-2 | 2018 | 1 | 20181105 | None | POLYGON ((138.93657 35.06657, 138.93655 35.066... |
| 2 | 0 | 02 | 0.013277 | 沈水植物群落 | 1 | 1003 | 013 | ホザキノフサモ群落 | WA8312 | R2018_85_11350_3_U29358 | 9-85-501-001-000-2 | 2018 | 1 | 20181105 | None | POLYGON ((138.93926 35.05376, 138.93923 35.053... |
| 3 | 0 | 02 | 0.024026 | 沈水植物群落 | 1 | 1003 | 013 | ホザキノフサモ群落 | WA8312 | R2018_85_11350_3_U29358 | 9-85-501-001-000-2 | 2018 | 1 | 20181105 | None | POLYGON ((138.93913 35.05392, 138.93914 35.053... |
| 4 | 0 | 02 | 0.062657 | 沈水植物群落 | 1 | 1003 | 013 | ホザキノフサモ群落 | WA8312 | R2018_85_11350_3_U29358 | 9-85-501-001-000-2 | 2018 | 1 | 20181105 | None | POLYGON ((138.93623 35.06915, 138.93621 35.069... |
| ... | ... | ... | ... | ... | ... | ... | ... | ... | ... | ... | ... | ... | ... | ... | ... | ... |
| 3188 | 0 | 79 | 0.009195 | 開放水面 | 28 | 28000 | 28 | 開放水面 | WA8312 | R2018_85_11350_3_U29358 | 9-85-501-001-000-2 | 2018 | 1 | 20181105 | None | POLYGON ((138.95272 34.98724, 138.95272 34.987... |
| 3189 | 0 | 79 | 0.016298 | 開放水面 | 28 | 28000 | 28 | 開放水面 | WA8312 | R2018_85_11350_3_U29358 | 9-85-501-001-000-2 | 2018 | 1 | 20181105 | None | POLYGON ((138.94891 34.98141, 138.94895 34.981... |
| 3190 | 0 | 82 | 0.011413 | ヤナギ高木林 | 12 | 12008 | 128 | ジャヤナギ−アカメヤナギ群集(低木林) | WA8312 | R2018_85_11350_3_U29358 | 9-85-501-001-000-2 | 2018 | 1 | 20181105 | ヤナギ | POLYGON ((138.93614 35.06527, 138.93615 35.065... |
| 3191 | 0 | 76 | 0.078064 | 人工構造物 | 26 | 28000 | 262 | コンクリート構造物 | WA8312 | R2018_85_11350_3_U29358 | 9-85-501-001-000-2 | 2018 | 1 | 20181105 | None | POLYGON ((138.90882 35.08336, 138.90879 35.083... |
| 3192 | 0 | 76 | 0.082595 | 人工構造物 | 26 | 28000 | 262 | コンクリート構造物 | WA8312 | R2018_85_11350_3_U29358 | 9-85-501-001-000-2 | 2018 | 1 | 20181105 | None | POLYGON ((138.91149 35.08144, 138.91145 35.081... |
3193 rows × 16 columns
Parameter Setting
Select the column to write vector value into pixel
[7]:
# Define parameters
label_column = '基本分類No'
Convert from Vector to Raster
[8]:
# Project the survey geo into same CRS as the reference image
geodata = geo_survey.to_crs(crs=image_ref.crs)

# Convert vector to raster
shape = image_ref.shape
transform = image_ref.transform
rasterize_array = rasterize(
    [(shape, label) for shape, label in zip(geodata['geometry'], geodata[label_column])],
    out_shape=shape,
    transform=transform,
    fill=0,
    all_touched=True,
    dtype=rasterio.float32)
[9]:
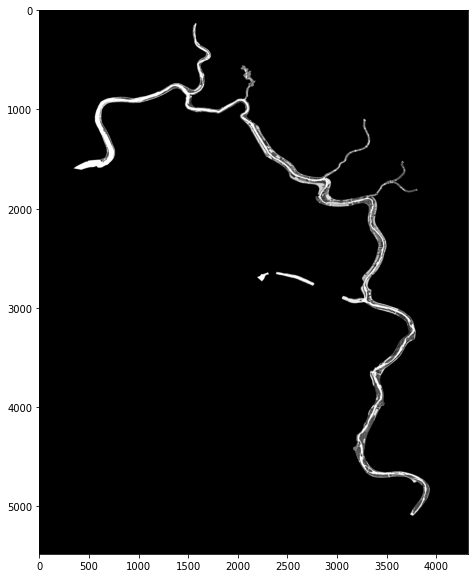
# Plot rasterized shape
plt.figure(figsize=(8,10))
plt.imshow(rasterize_array, 'gray')
plt.show();
[10]:
# Write rasterized array to image (.tif)
with rasterio.open(
    'rasterized-results.tif', 'w',
    driver='GTiff',
    dtype=rasterio.float32,
    nodata=0,
    count=1,
    width=rasterize_array.shape[1],
    height=rasterize_array.shape[0],
    transform=transform,
    crs=image_ref.crs
) as dst:
    dst.write(rasterize_array, indexes=1)